About the project
The rich tradition of mapping macroorganism diversity patterns and ranges has been crucial for understanding the evolutionary and ecological processes that shape contemporary biodiversity and for conservation. Mapping bacterial diversity patterns and ranges will similarly clarify the mechanisms structuring bacterial communities, uncover processes shaping global diversity, and improve our understanding of the biogeochemical cycles and ecosystem services for which bacteria are critical components. Unfortunately, there have been impediments to constructing diversity and range maps for bacteria, including most notably the geographically sparse sampling of bacterial communities.
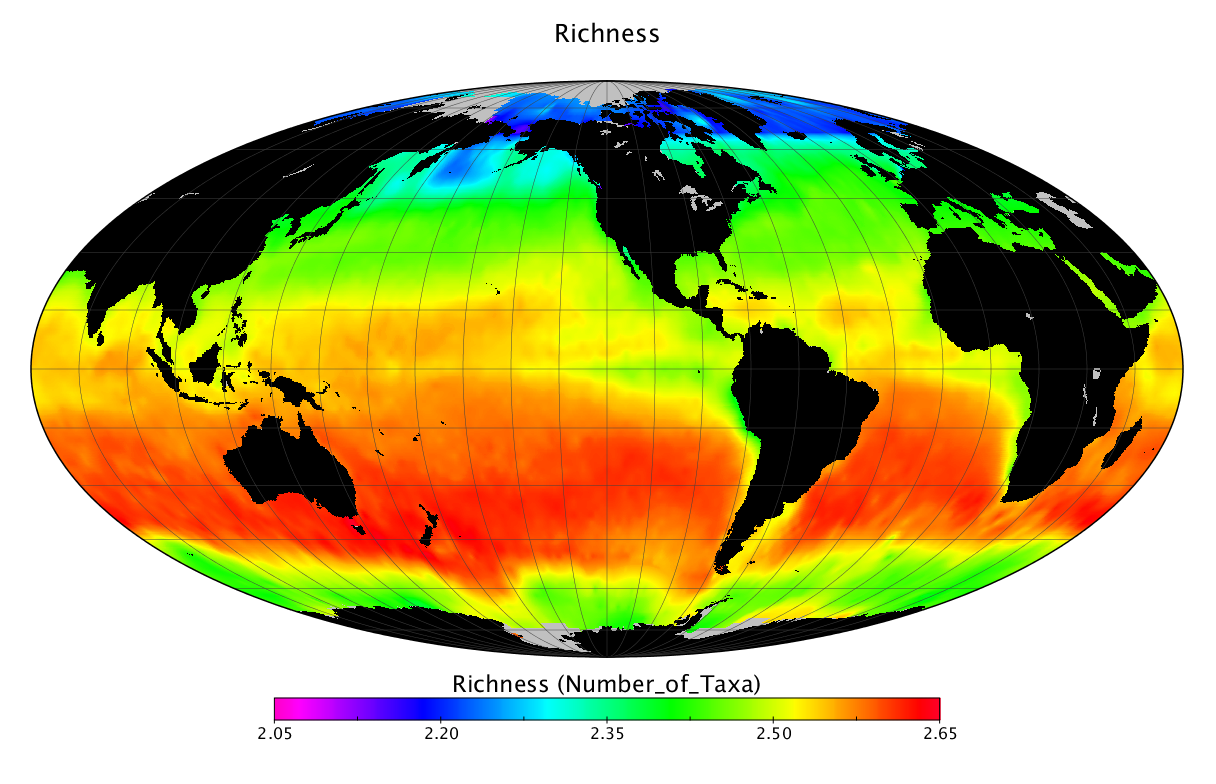
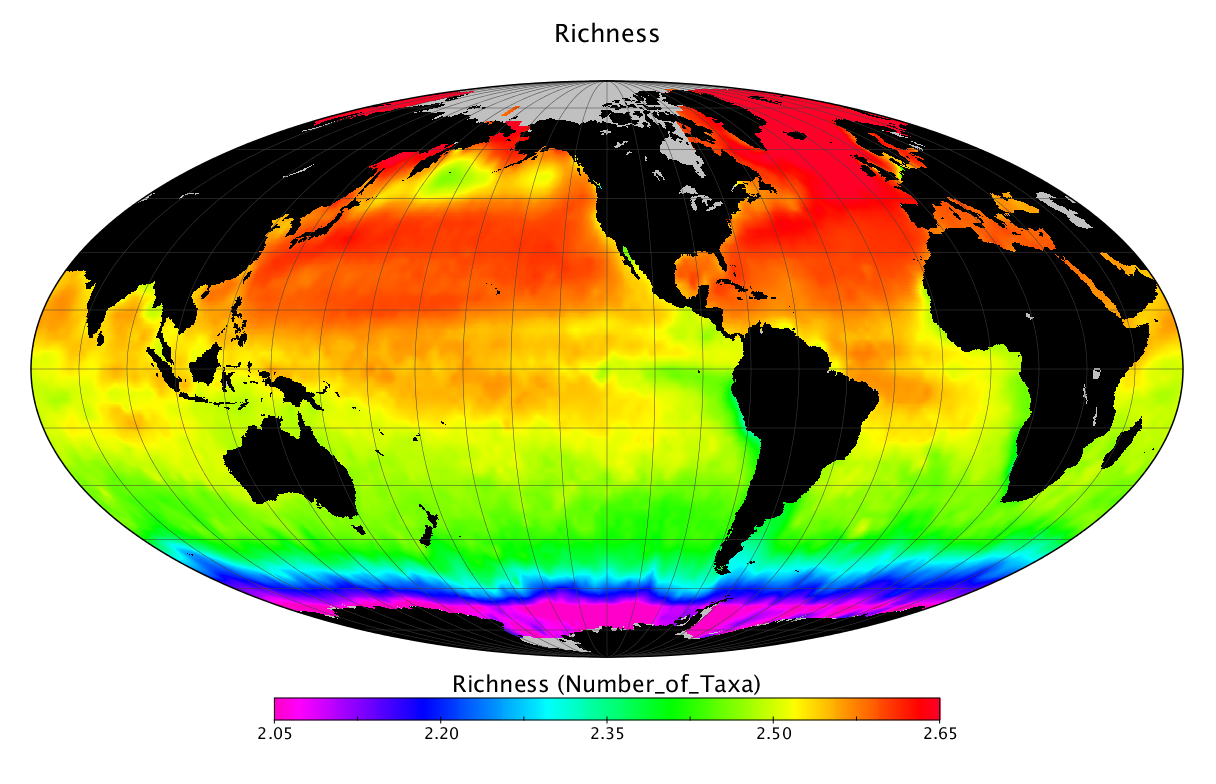
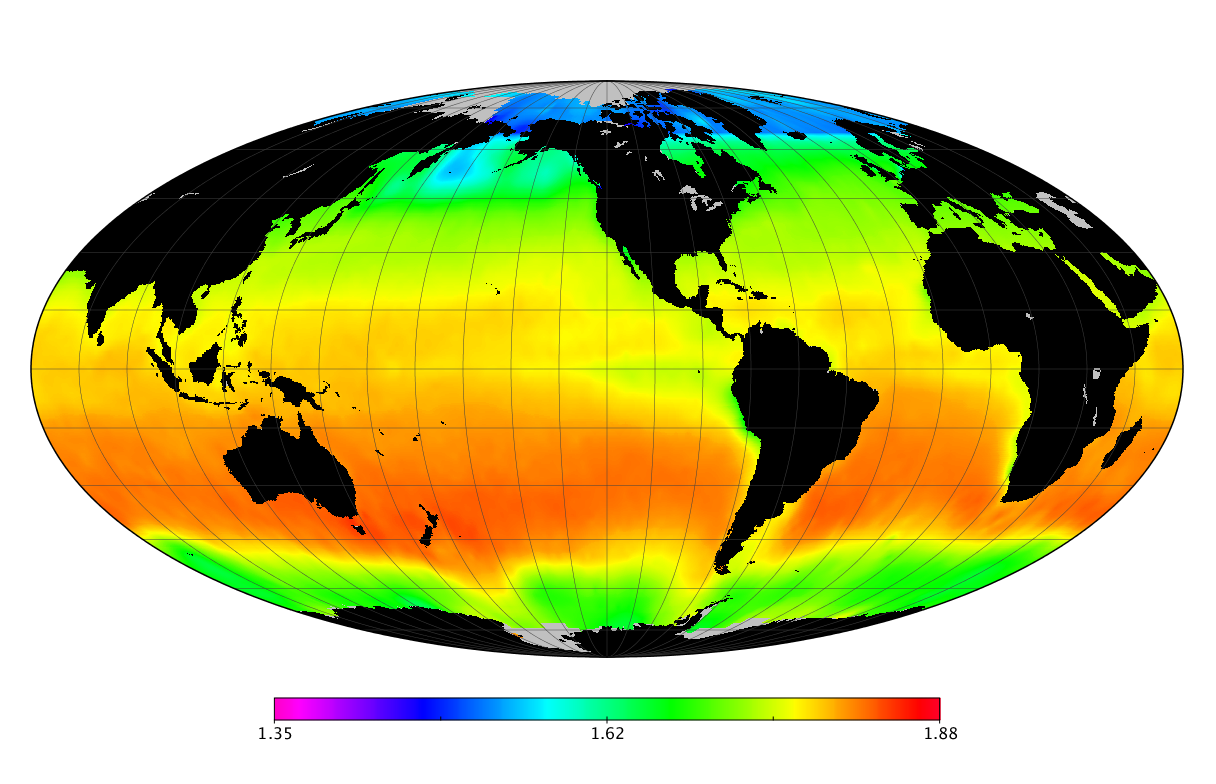
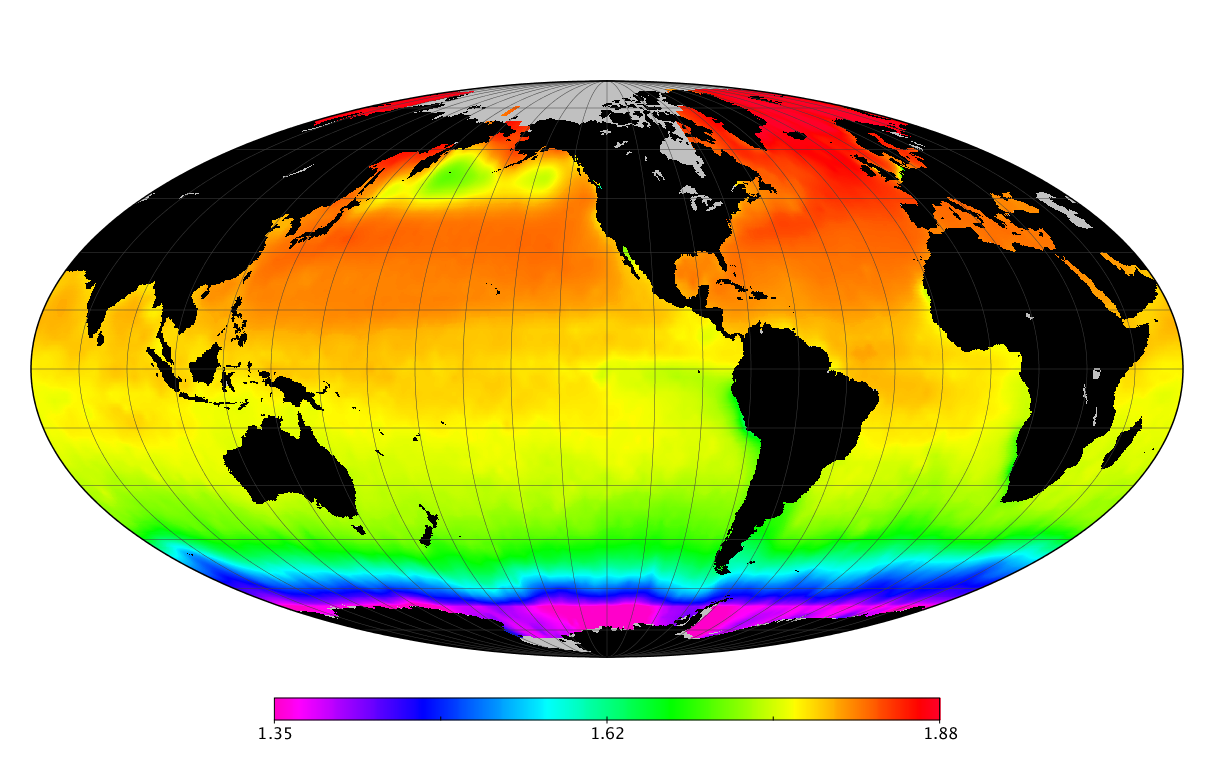
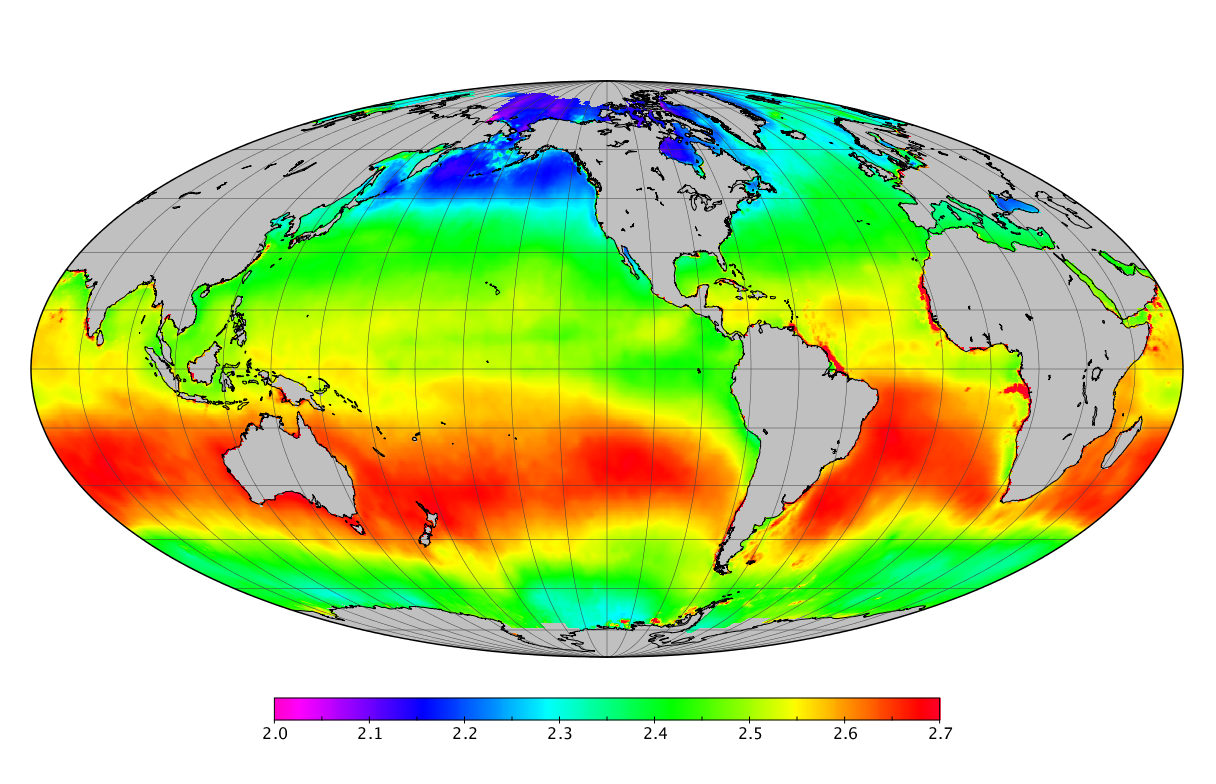
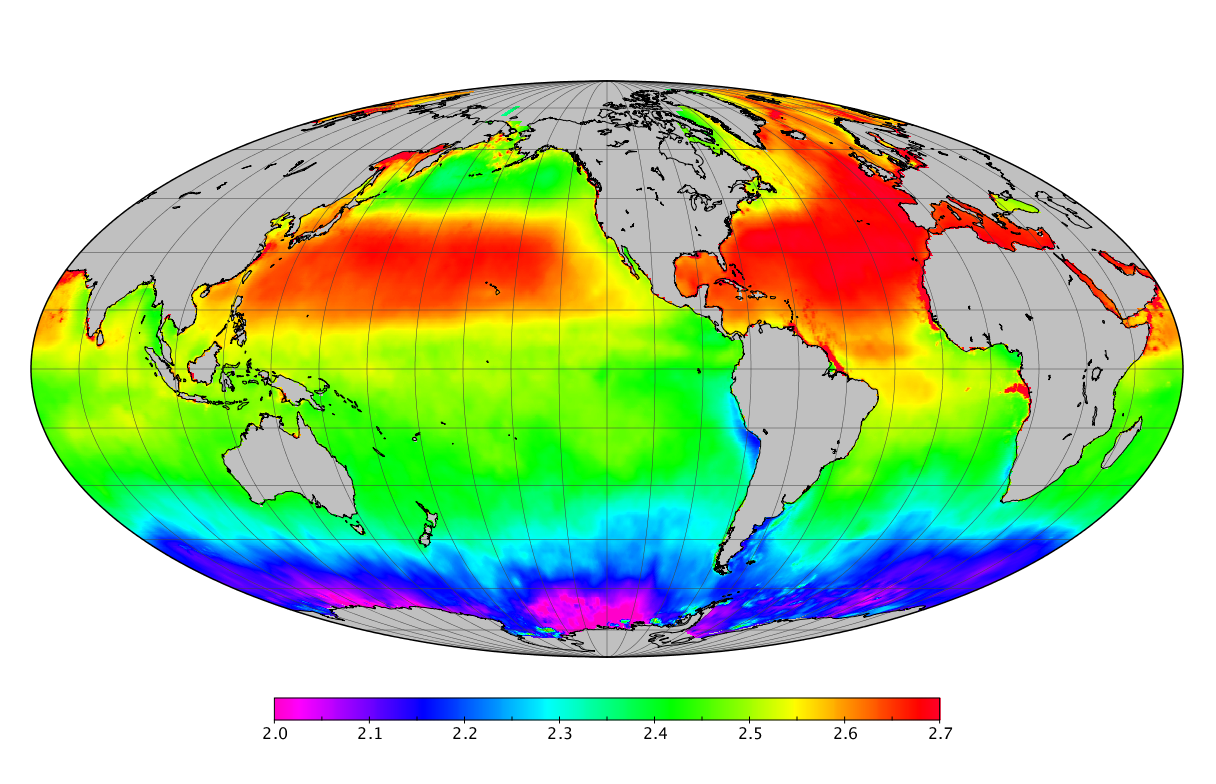
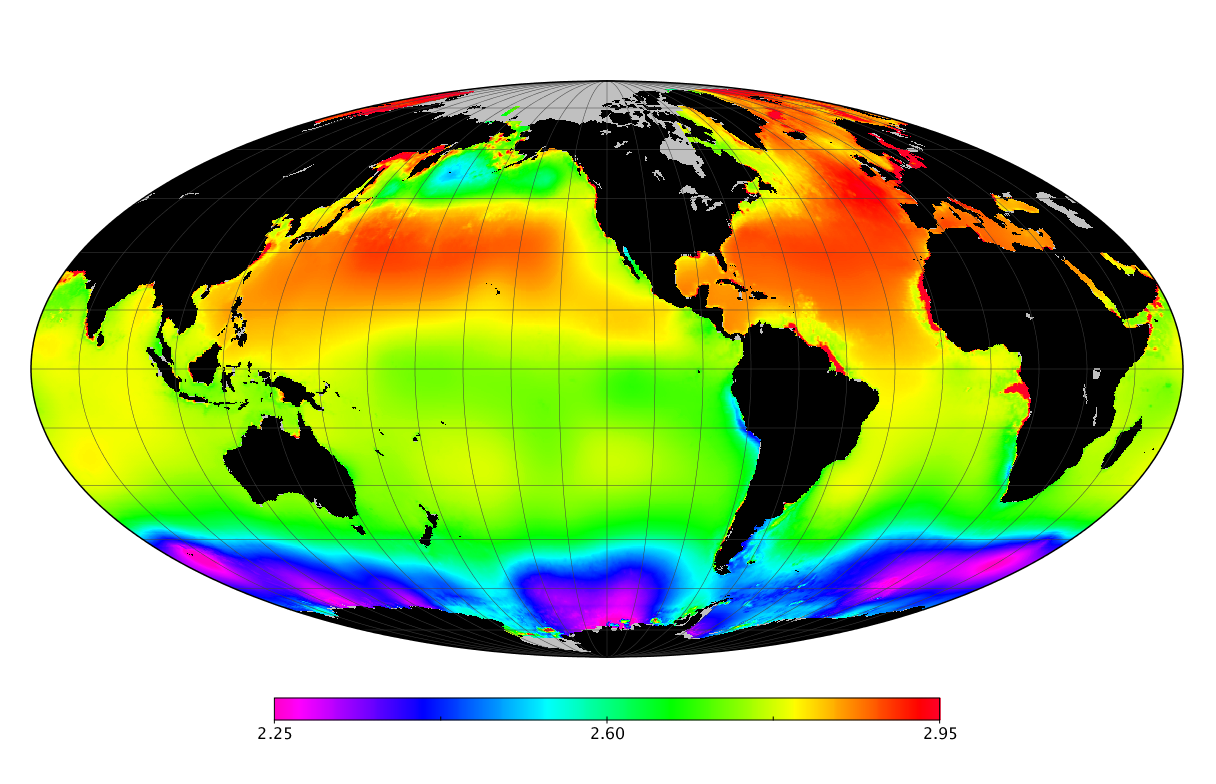
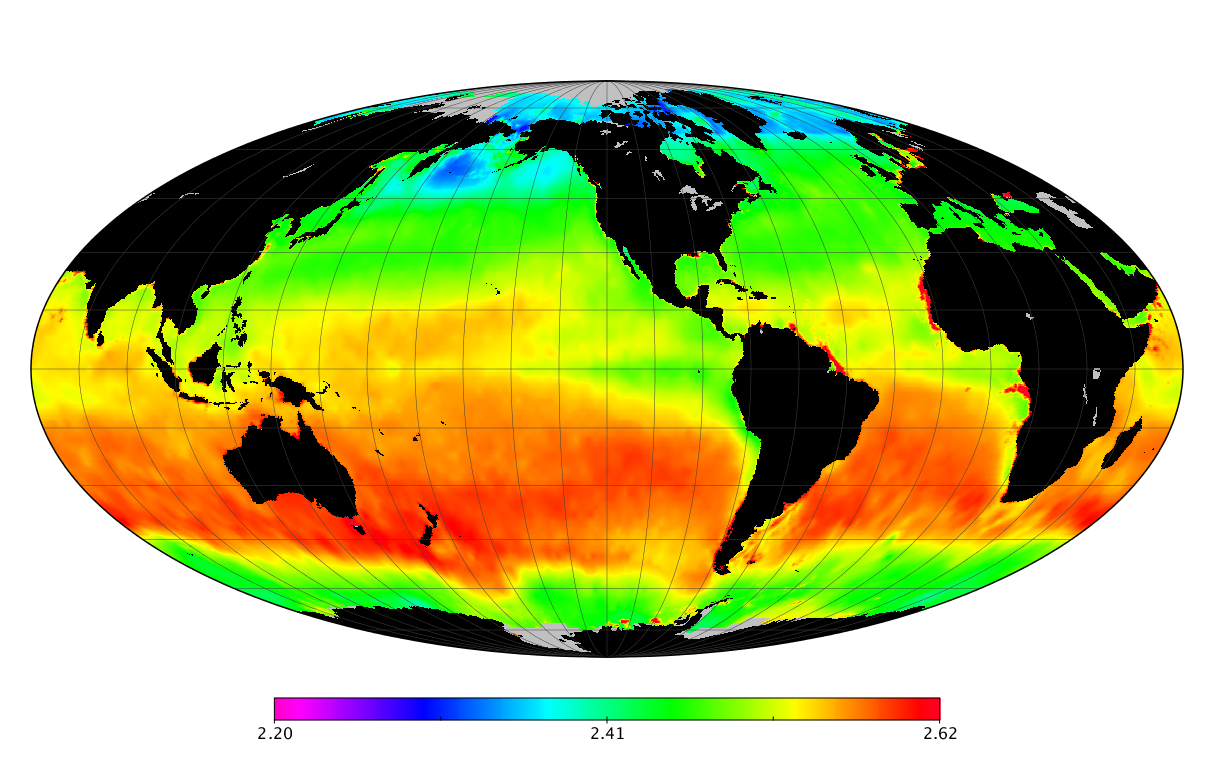
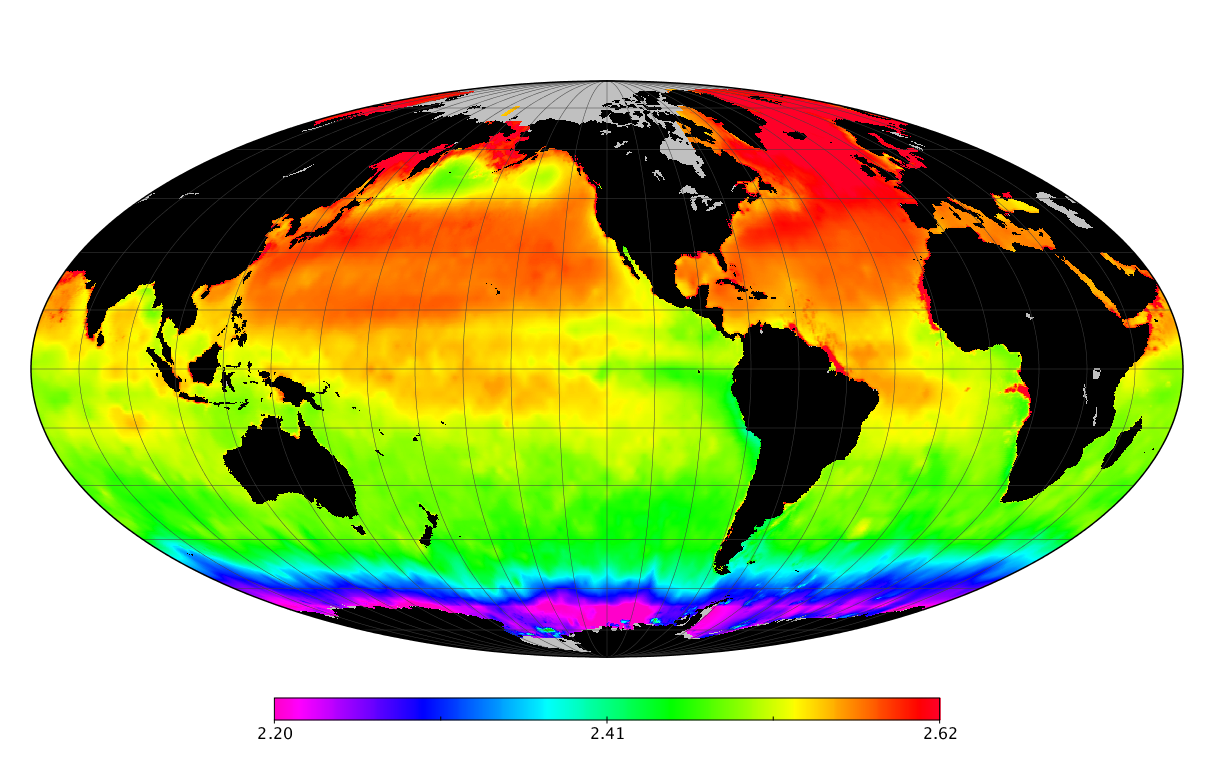
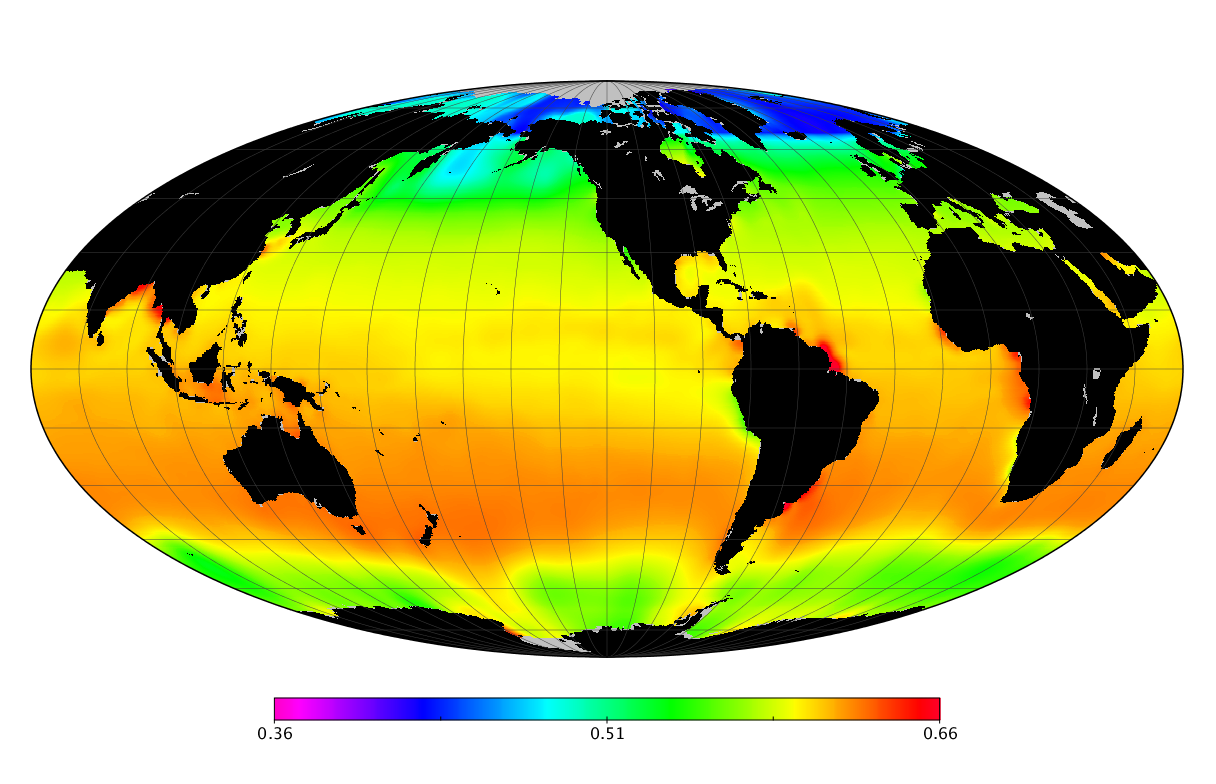
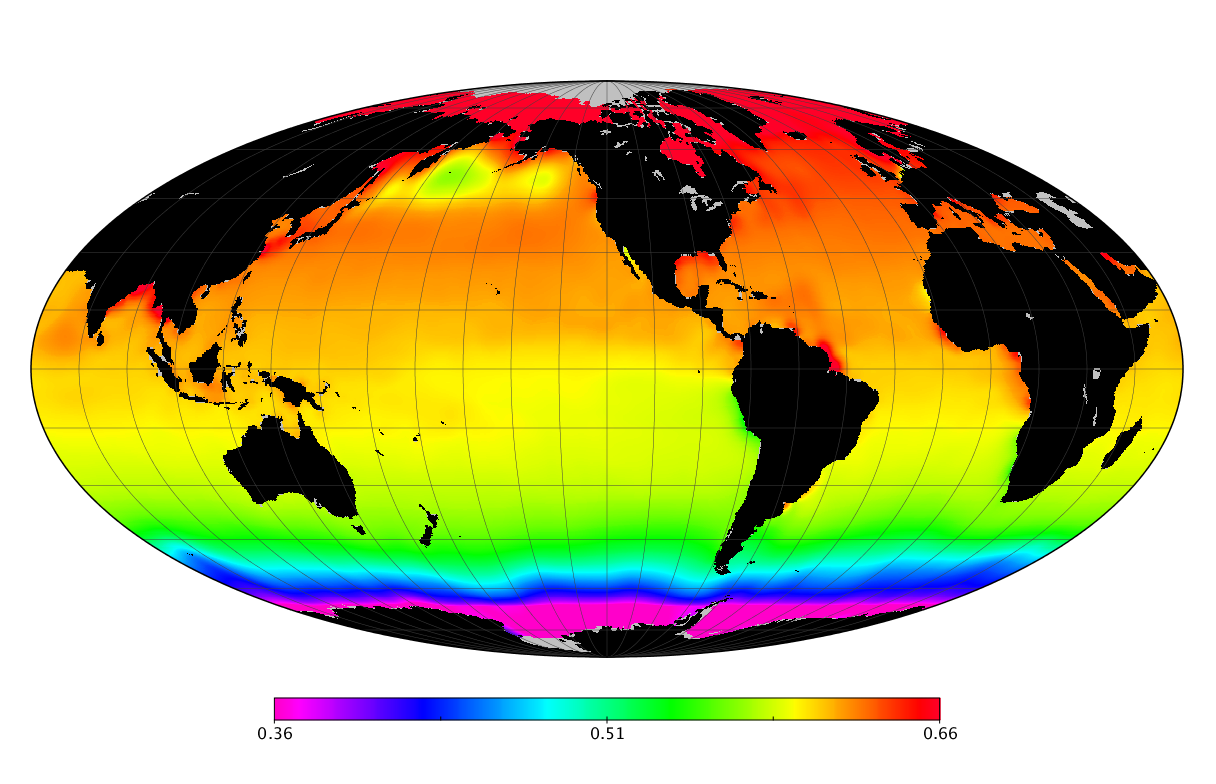
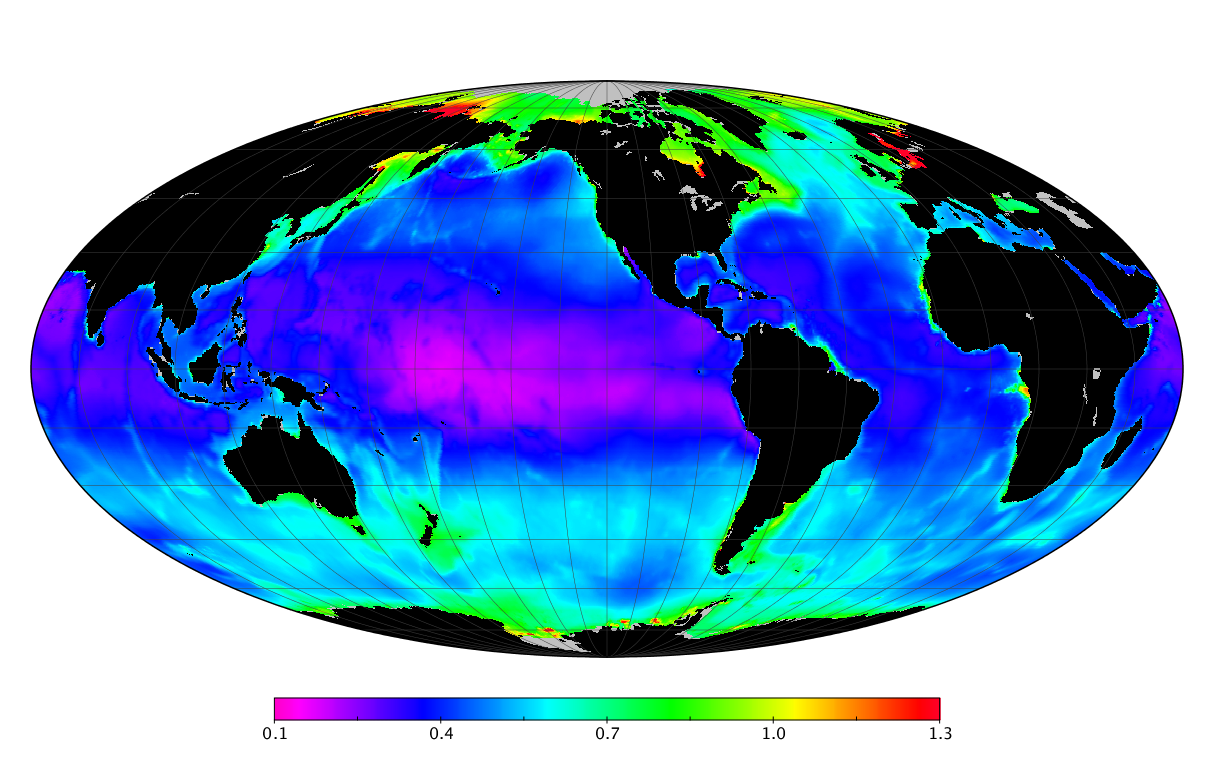
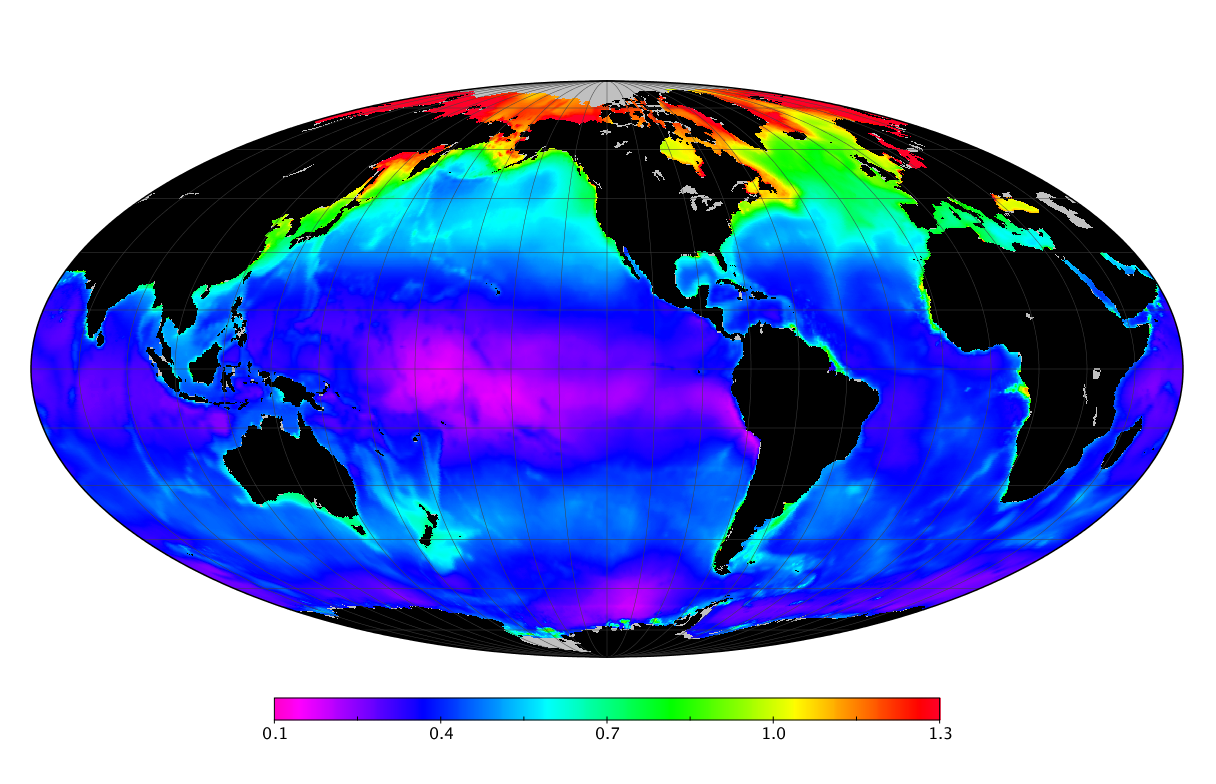
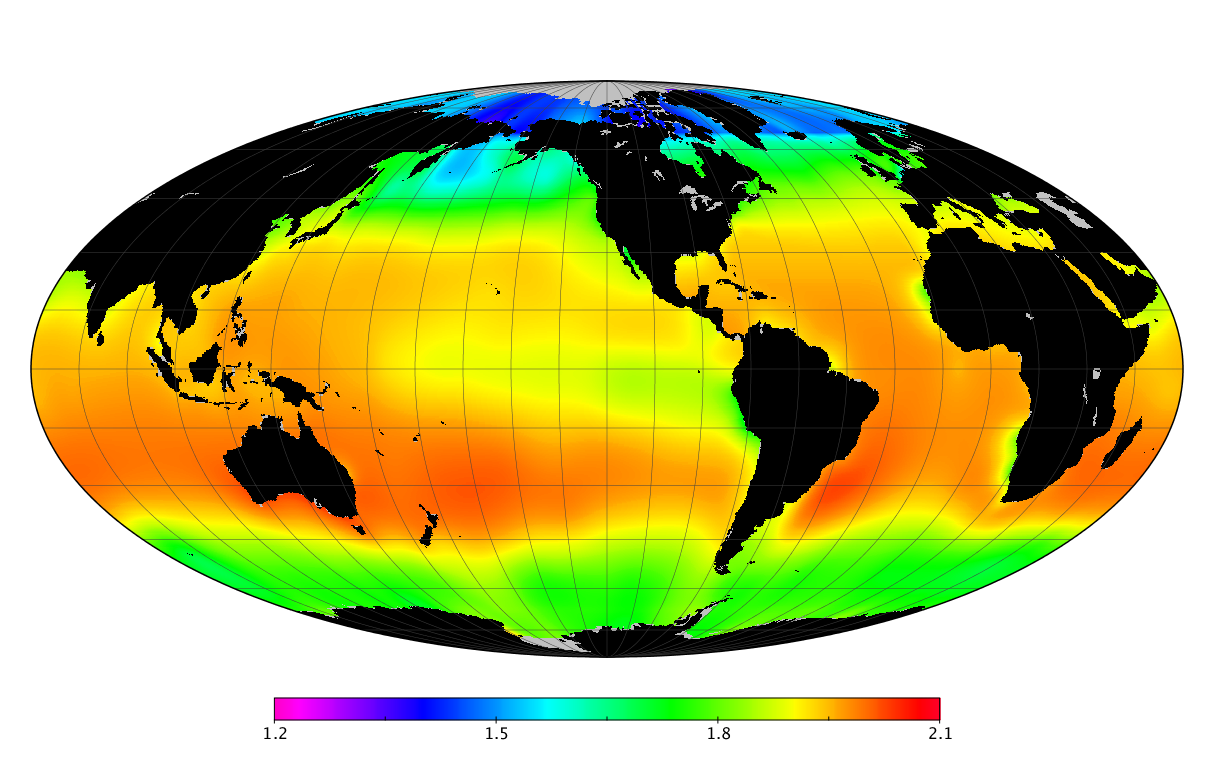
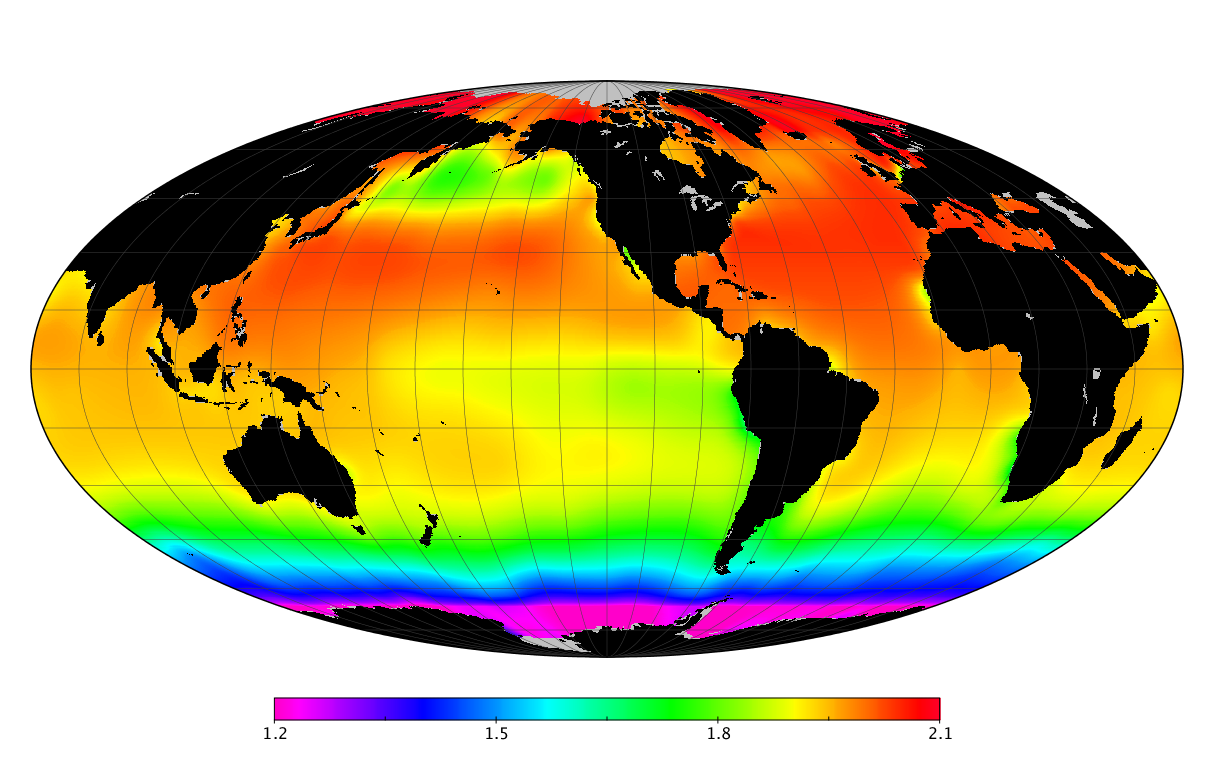
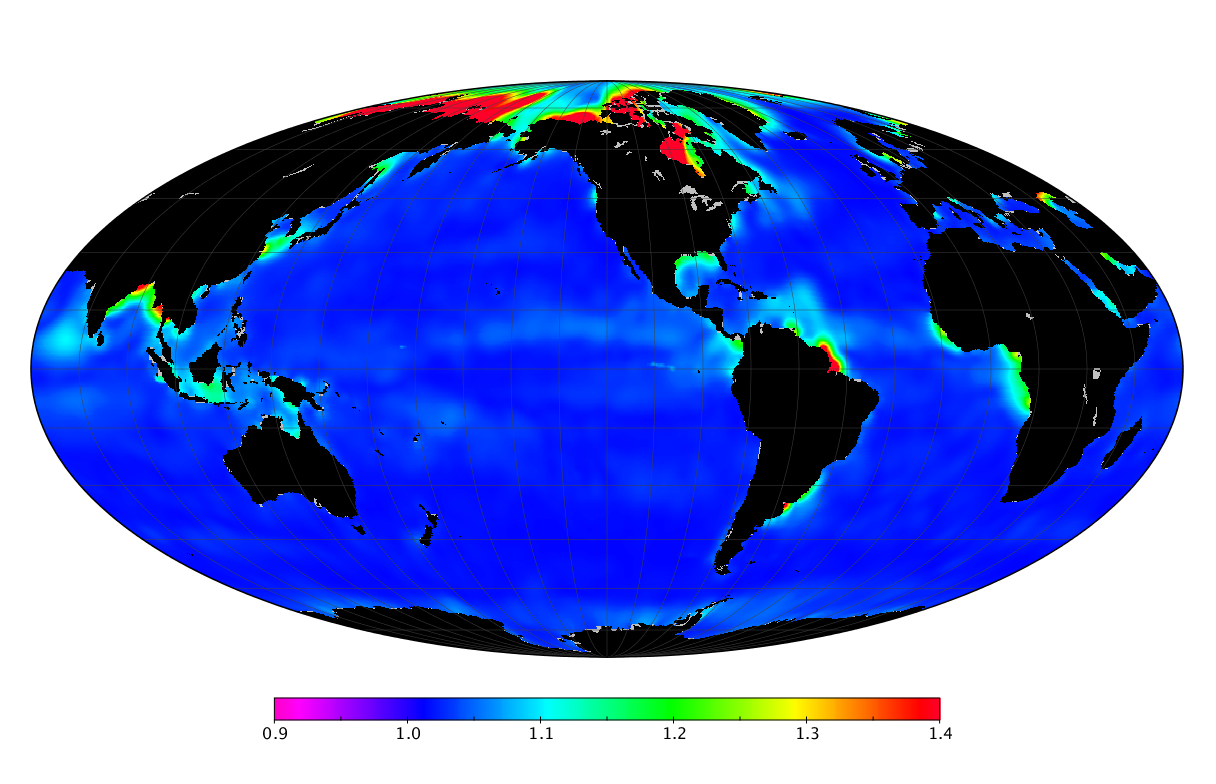
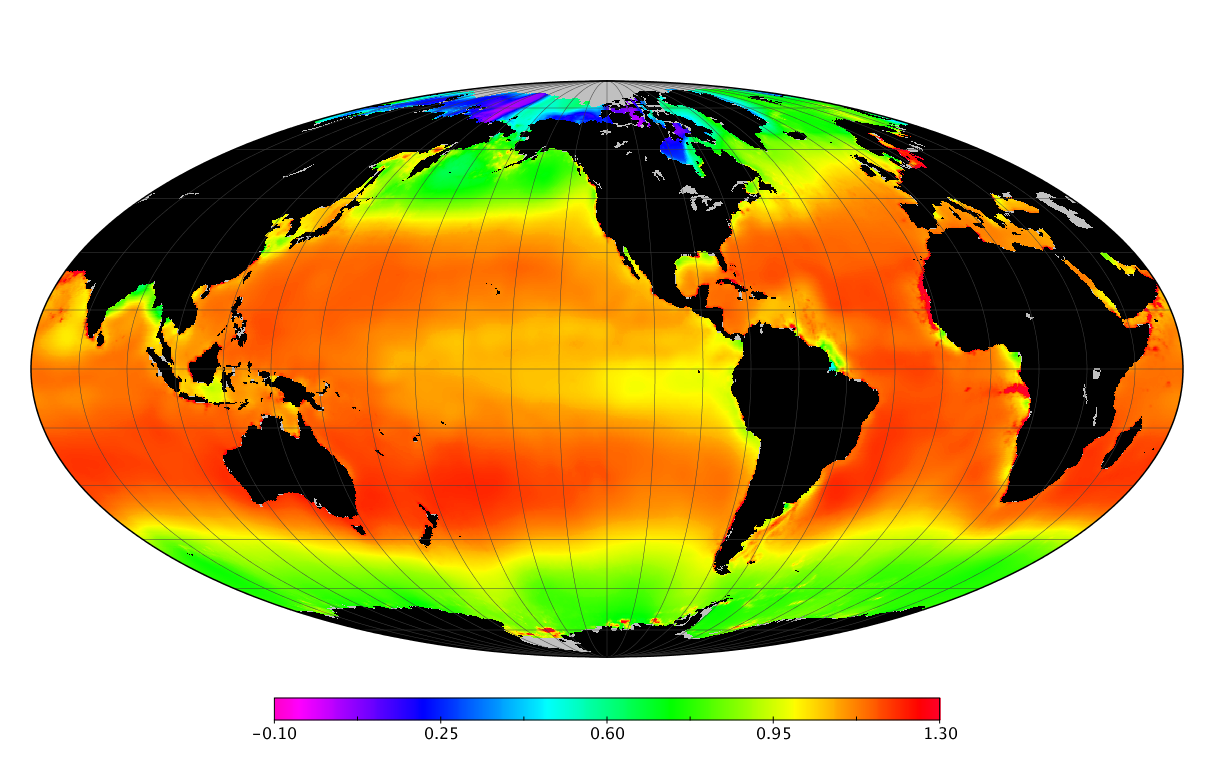
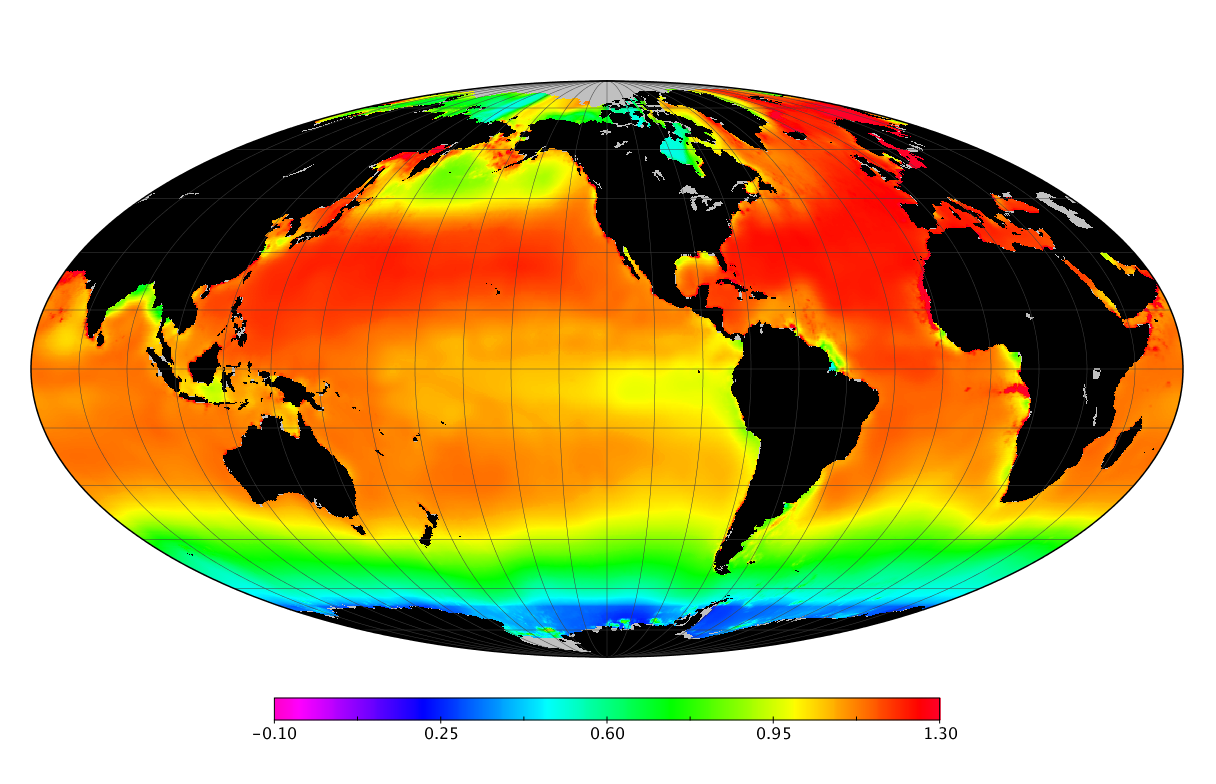
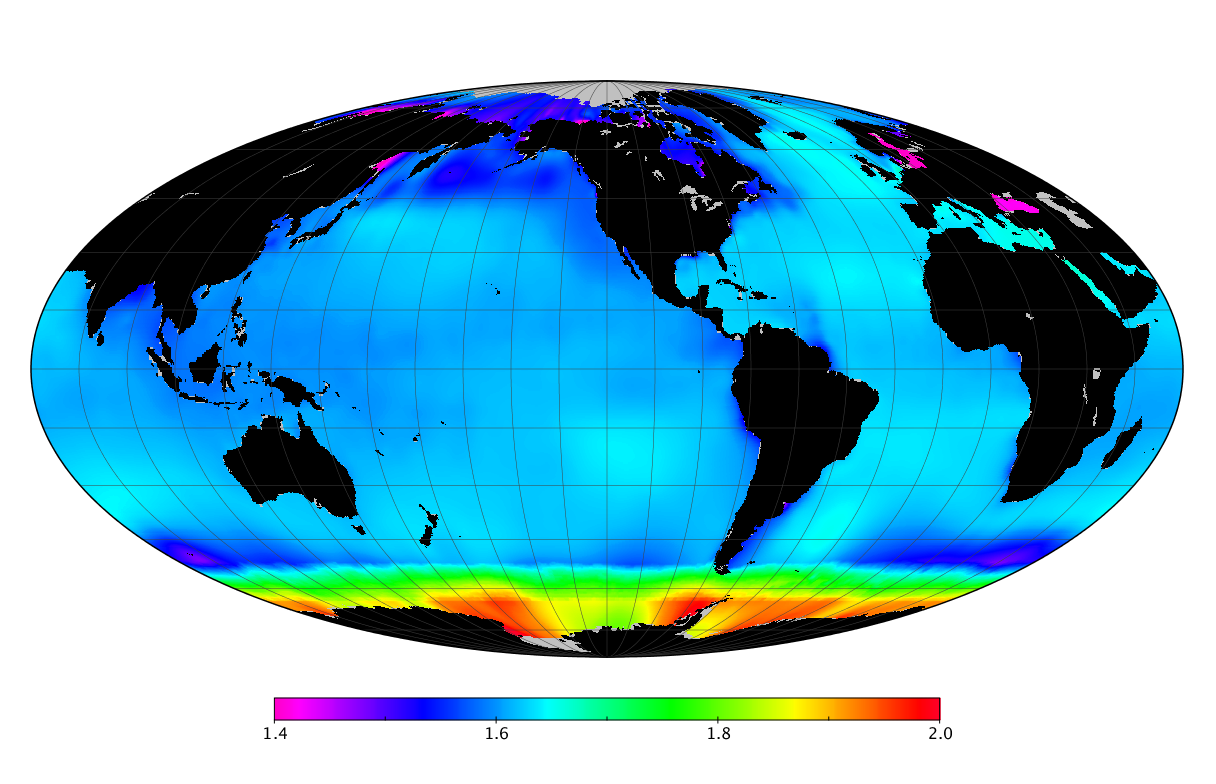
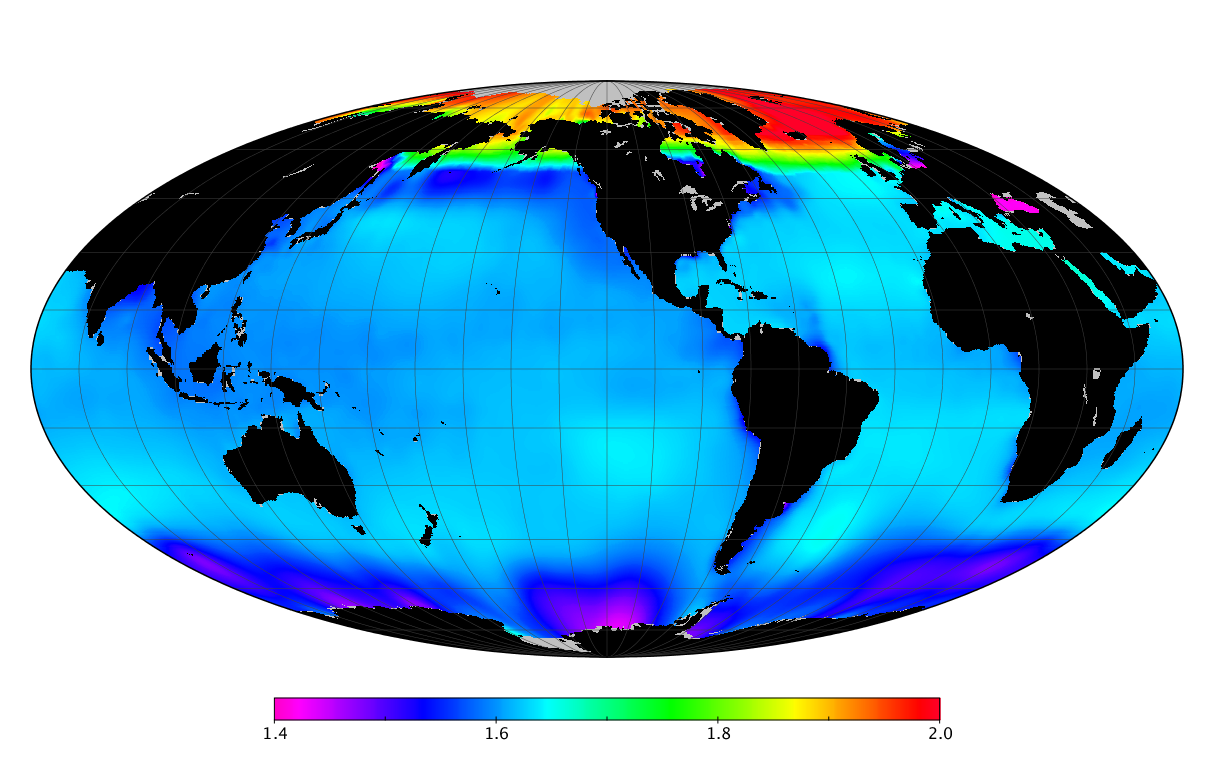
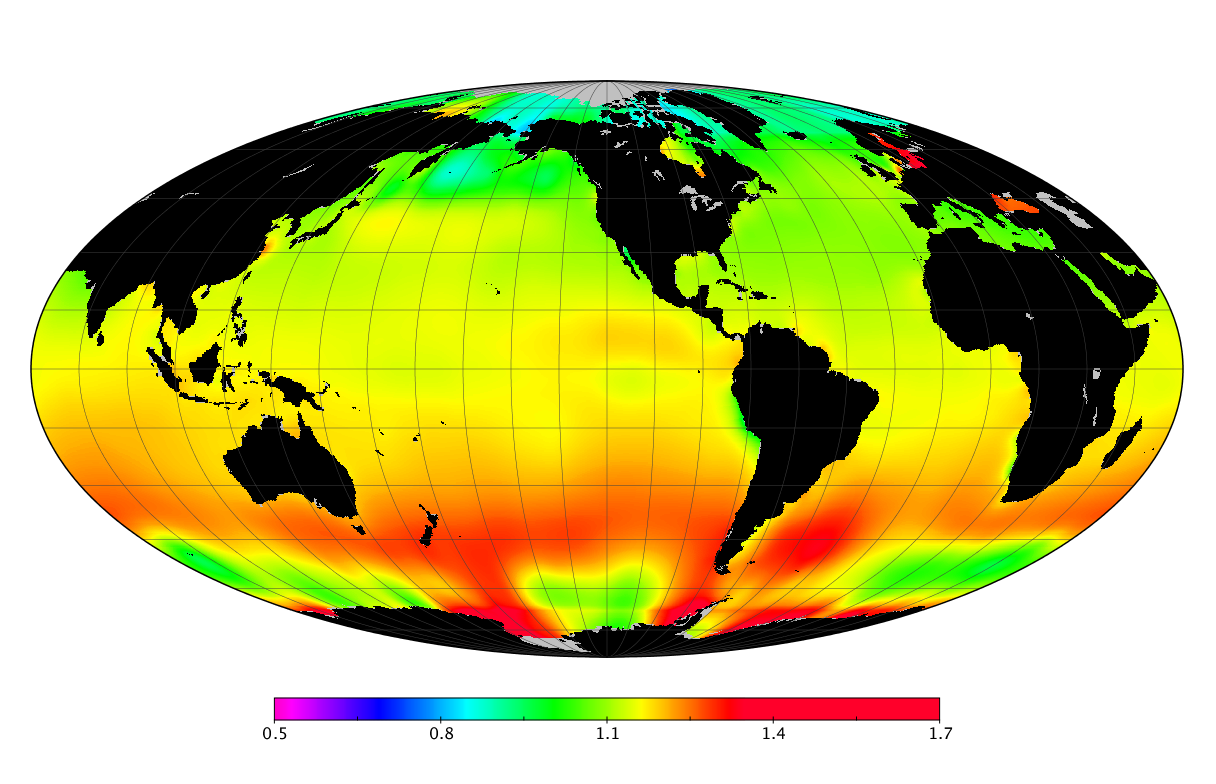
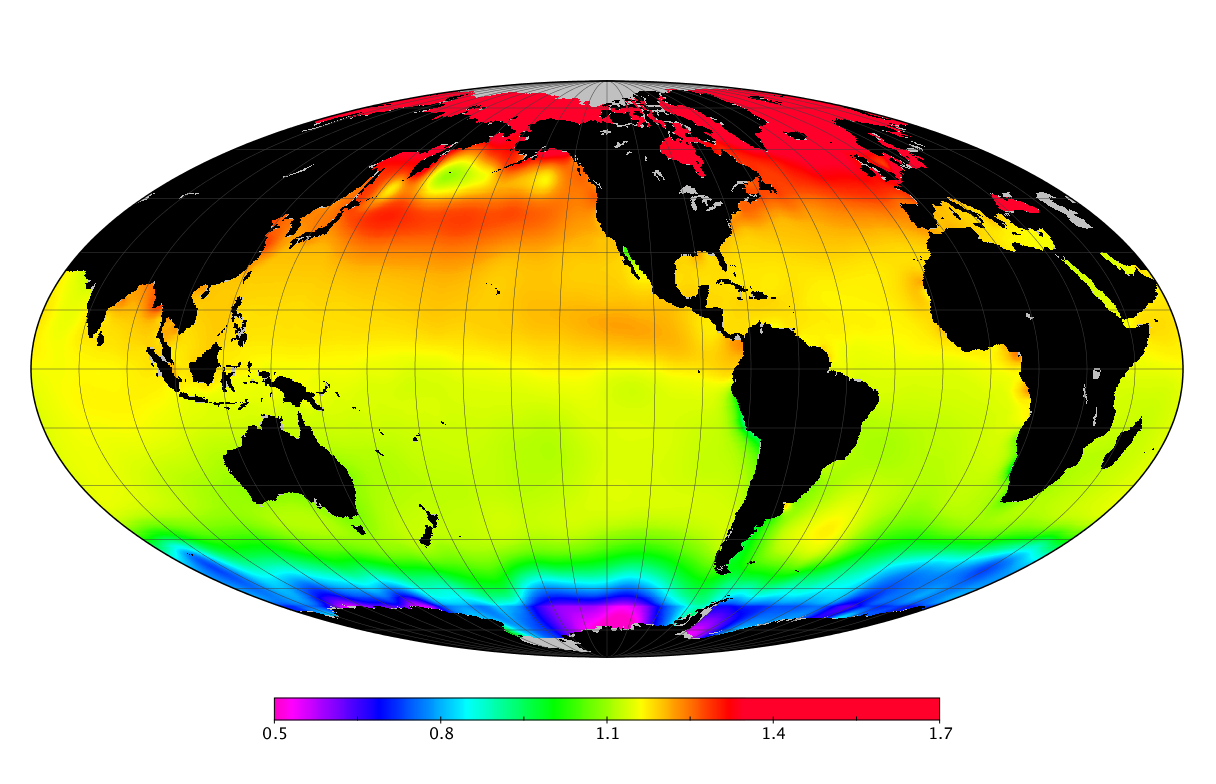
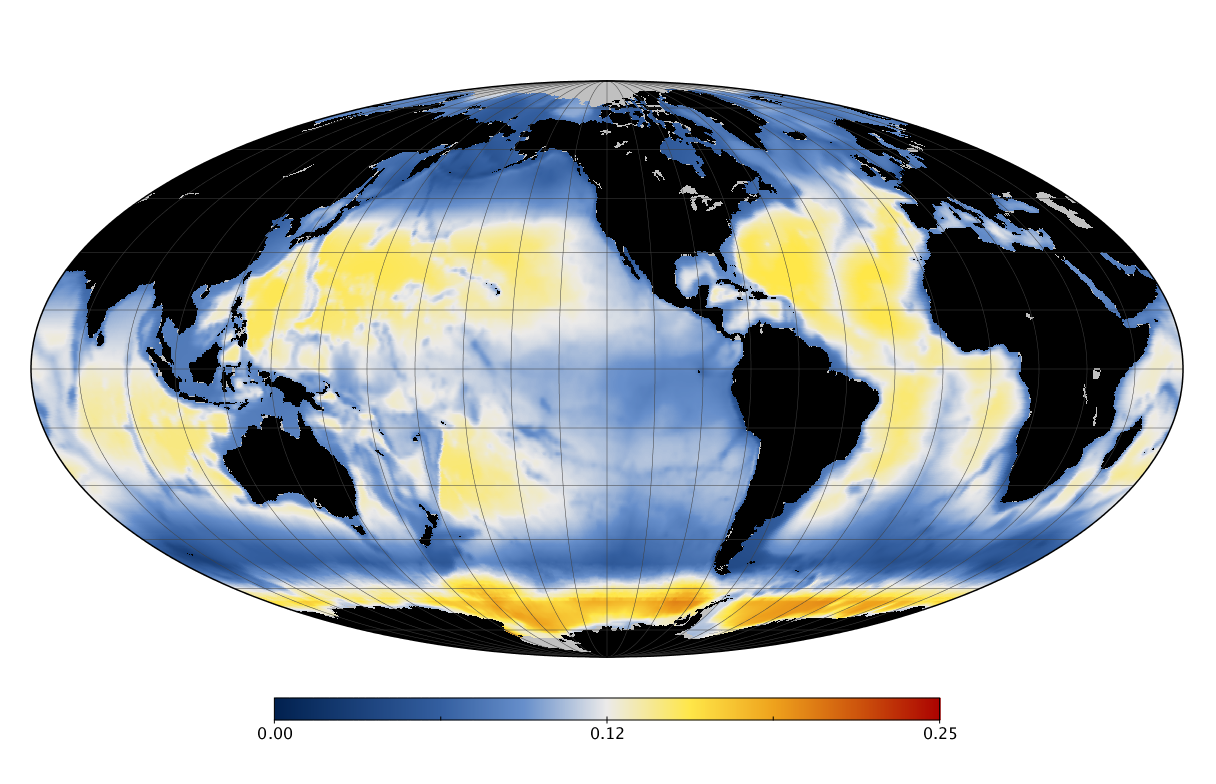
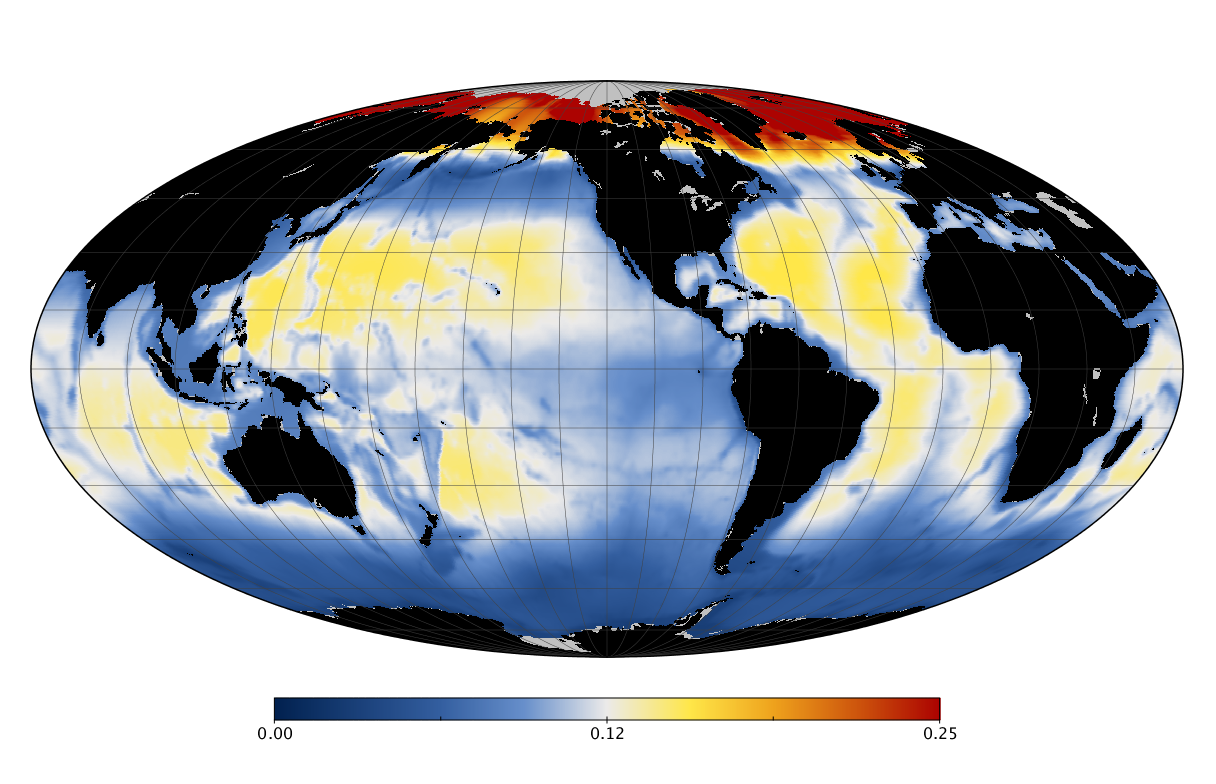
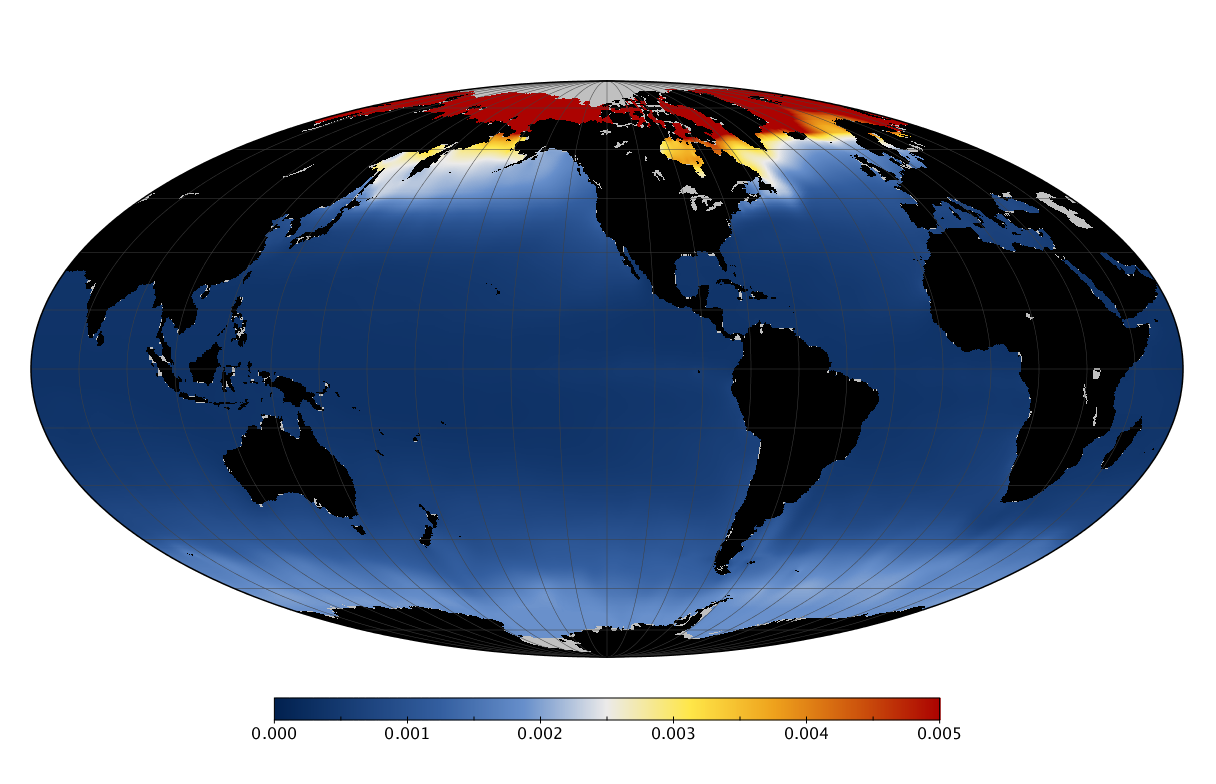
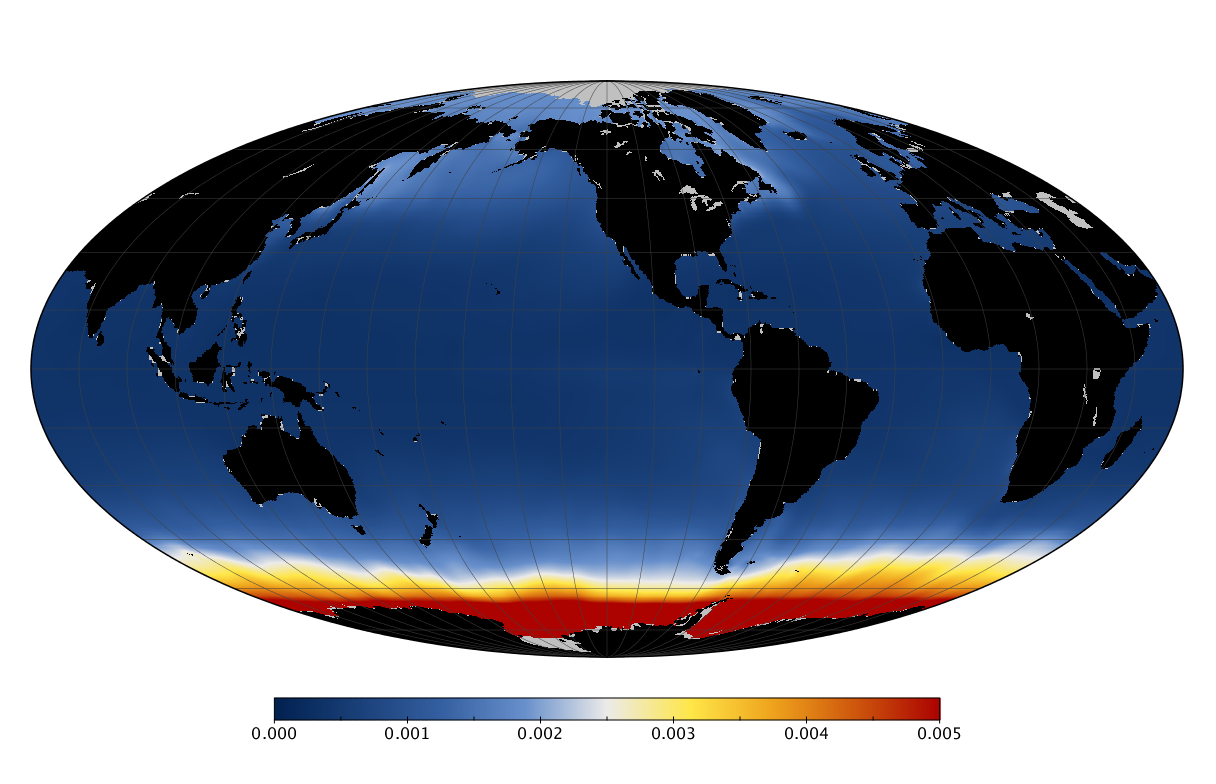
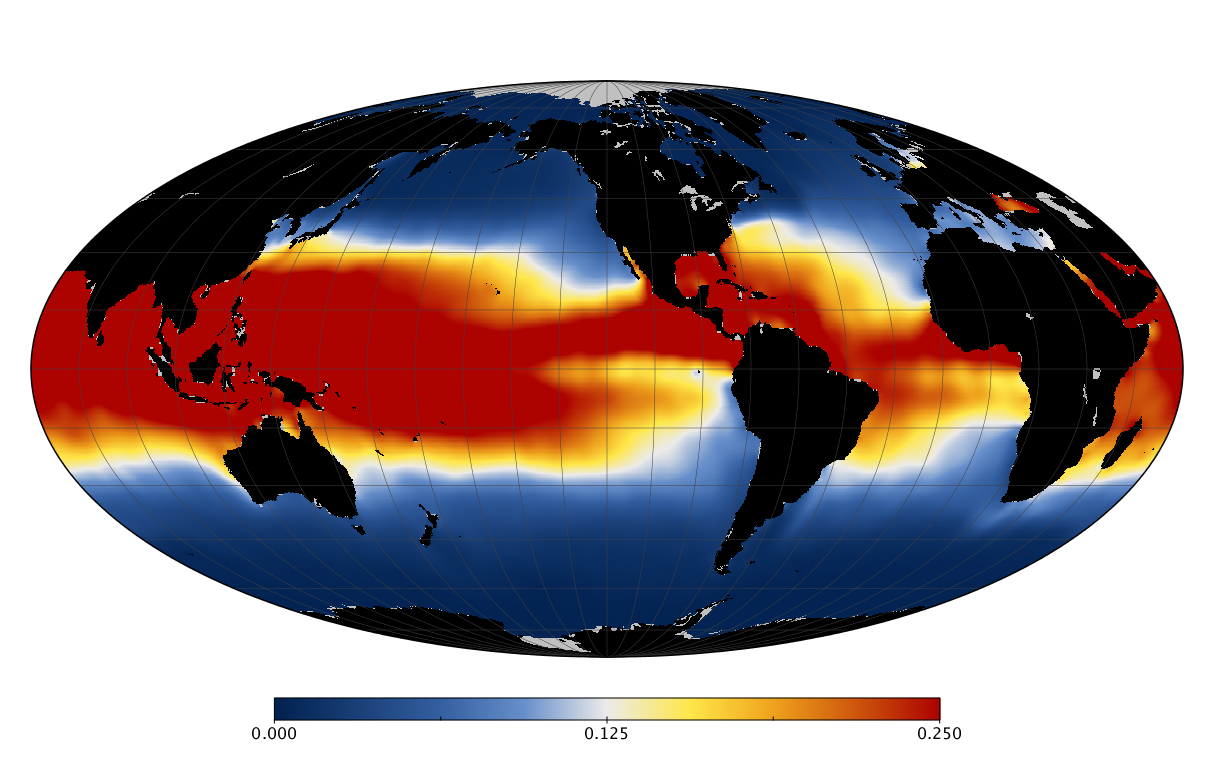
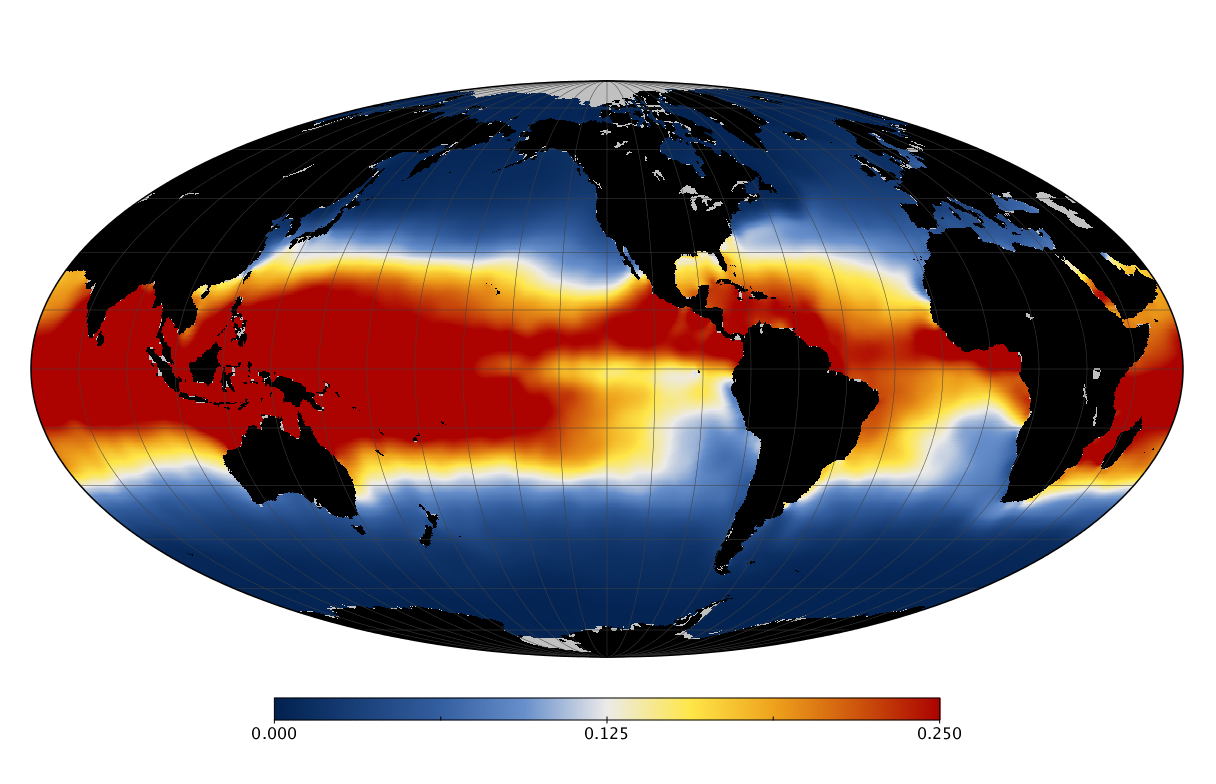
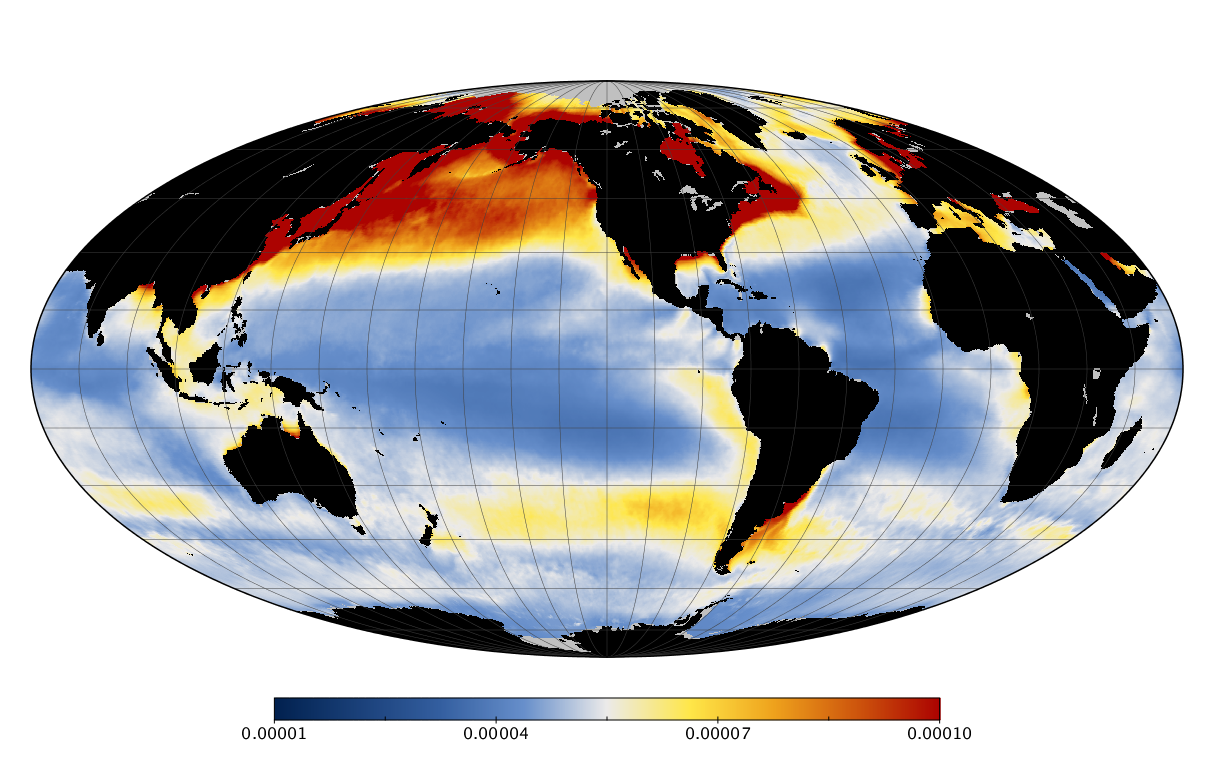
Here we solve this problem by using species distribution models (SDMs) to construct global diversity and range maps of epipelagic marine bacteria from a database of bacterial rDNA sequences that we complied from available marine sampling studies. Our spatially explicit diversity maps reveal that epipelagic bacterial diversity peaks in temperate latitudes during the boreal and austral winters, and that these locations have low diversity during the boreal and austral summers. The temperate, seasonally-dependent diversity peaks contrast with the tropical, seasonally-consistent diversity peaks observed for most macroorganisms. We also find that global hotspots of epipelagic bacterial diversity occur in regions with high levels of human impacts to the oceans. Our maps provide the first global picture of marine bacterial diversity and ranges, and contribute to the expanding foundation of microbial biogeography.